

Pause, Practice, & Play™: Teaching Supply & Demand
Applying the Pause, Practice, & Play™ framework in teaching the Supply & Demand Model in a Principles of Microeconomics course

Pause, Practice, & Play™ is a framework I developed for designing and facilitating experiences that cultivate belonging, deepen understanding, and support sustainable learning across modalities. Rooted in nervous system regulation, active skill‑building, and playful integration, this framework guides each module, lesson, and learning experience I create.
Below I share how I utilize my framework to teach the Supply & Demand Model…
Pause
In my last post, I shared how I invite my students to Pause with a Butterfly Hug and lead from our center at the beginning of Module 3 - Supply & Demand and Market Failures in my online, asynchronous Principles of Microeconomics.
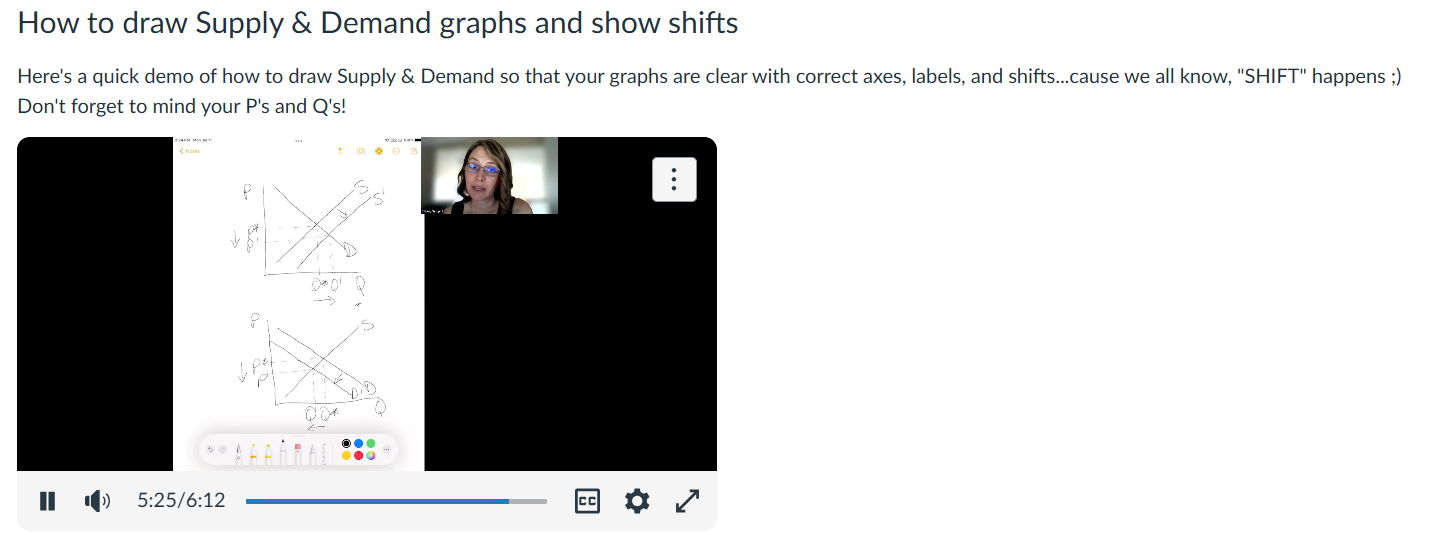
Next, we move into the content of Module 3 and Practice Supply & Demand graphs and core concepts...
Practice
Magic Model reMinders
When drawing the Supply & Demand Model, remember:
“D-d-d Downward Sloping” Demand
“Up-up-up to the Sun” Supply
Mind your P’s & Q’s → Prices and Quantities (AND Please’s & Thank You’s like my mom always said)
Draw it out with me then do it 1,000+ more times until your hand draws it in your sleep… 😜
“Shift Happens”
The Demand Curve Shifts
Shifters of the Demand Curve (C-SPINE):
Price of Complementary goods
Price of Substitute goods
Preferences
Income: normal or inferior goods?
Number of buyers in the market
Expectations about the future
The Supply Curve Shifts
Shifters of the Supply Curve (TWINE):
A change in Technology
Weather
A change in the price of an Input (and substitutes & complements of that Input)
Number of sellers in the market
Expectation of future price changes
We do not necessarily know the size of the shift, but we can see the direction of the shift.
More Magic reMinders
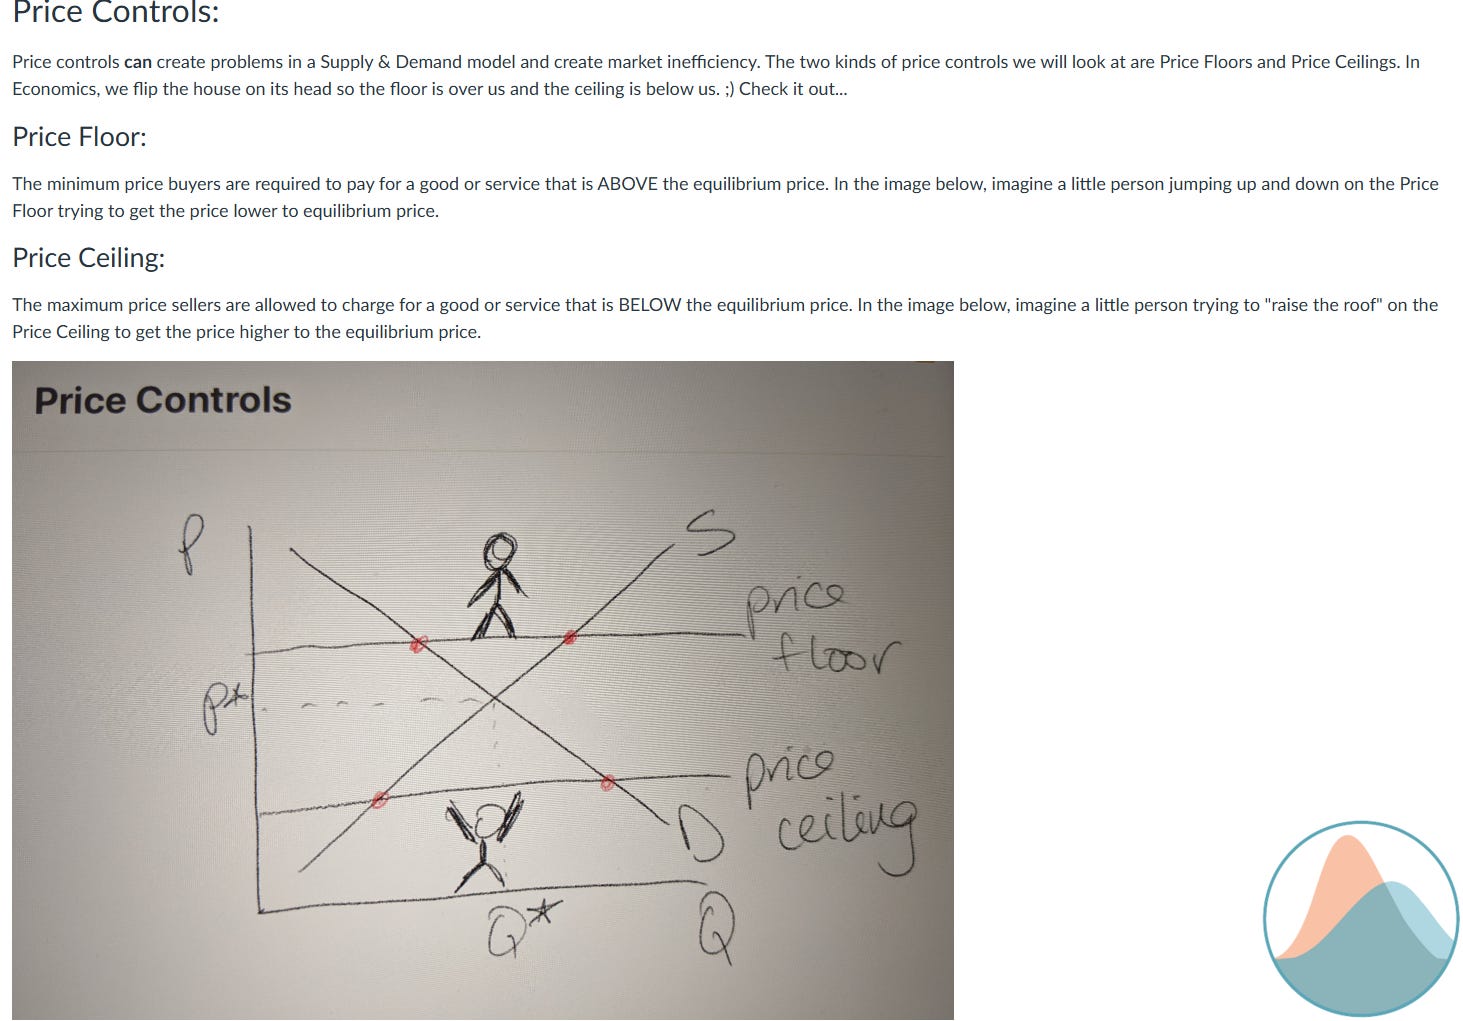
Price Interventions
🦘Price Floor - Jumping Up and Down trying to drop the floor
🏋️Price Ceiling - Trying to “Raise the Roof”
The market is always trying to get back to the equilibrium price and quantity.
🏴☠️Deadweight Loss:
Ultimately, a price control can cause Deadweight Loss (DWL) in the market - loss to Total Surplus (Consumer Surplus + Producer Surplus). No one benefits from DWL…Not even the parrots! 🦜
I like to say it in my best pirate-y voice: “Deadweight loss, arrrrgh!”
Then, in my face-to-face classes, throughout the semester, my students know when I hold my finger up like a hook and shut one eye, it is their cue to say: “Deadweight loss, arrrrgh!”🪝
Play
Once students can draw graphs and name shifters and interventions, we Play with the model to deepen understanding.
Activities
Reservation Price
I auction off $1 (here are the MRU instructions)
For asynchronous classes, this is just a slide in my deck that invites them to ponder what they would bid.
For Hybrid and Face-to-face classes:
I fold up the money first so they don’t know how much it is and take bids.
Then I ask them to Reflect: Tell me about a time you wanted to buy something that you thought was TOO expensive.
Why did you think it was too expensive?
What was the maximum price you were willing to pay for it (aka: your buyer reservation price)? Why?
Supply & Demand BINGO!
Back in the day…
I would make my students draw out their own Bingo Cards. This took a while, but was GREAT practice and I could be assured they had drawn out each possible shift.
I used CANDY as their Bingo chips to cover the squares. Who doesn’t want CANDY?! (Starbursts work well)
Then after we’d practiced and played Bingo, I’d tell them to cut up their Bingo card and turn each square into a flashcard to use as a study aid for the exam.
(Just my $.02, but I still think this is a great idea…even in this digital age. Our brains need to write stuff out. Especially if you are teaching only face-to-face, you could assign the Bingo card creation as a homework assignment then give them points or an additional FREE Square for bringing it to class ready to go.)
These days…
Online Bingo Cards: BingoBaker.com (MANY THANKS to BingoBaker!!!)
There’s a ton of cards already made, but I built my own with all the possible shifts in graph form. Then I made 7 versions of the card and included each link in my assignment online, and assign them to my students based on the first letter of their last name. So there are 7 different cards and dispersed amongst the students.
Then I post/show a slide deck with a ton of scenarios that may (or may not) shift either or both Demand and Supply Curves.

Title slide for my Supply & Demand BINGO game

Online BINGO Activity Instructions:
Click on the Bingo Card below that is assigned to you based on the first letter of your last name.
Open the BINGO Slides linked above and click on the square on your Bingo card that matches the shift(s) from the scenario. There are 15 scenarios.
If you get a BINGO before you have completed all of the scenarios, CONGRATULATIONS! ;) You may brag in your post. Screenshot or take a picture of your Bingo card with the squares marked (.jpg works well) and upload it to your post and we’ll double check that you actually got it.
OR: If you did NOT get BINGO, please screenshot or take a picture of your completed Bingo card and upload it to your post. (Sorry you didn’t get Bingo). If the scenarios were the same, which card do you want next time?
Then, give an example of your own. State the market and the scenario. Ask your classmates, “What shifts?”
Respond to 2 of your peers’ posts, congratulating or commiserating with them as appropriate and stating what you think shifts in their market scenario.
🍋Lemonade Stand Game
(Lemonade Stand – CoolMathGames.com, Cyber Version)
Instructions:
Play the 7‑day Lemonade Stand simulation (CoolMathGames or similar) and track your data.
Debrief with the questions below:
• What does profit represent in this game?
• Can you identify the seller’s (producer’s) reservation price?
• Can you identify the buyer’s (consumer’s) surplus?
• How is the market equilibrium price determined?
Then What If?!
• What if there is a freeze in the late spring and there is a shortage of lemons?
• What if a chemical sprayed on lemons is found to cause cancer?
• What if the government subsidizes lemonade production by setting a minimum price per cup?
• What if there is cheaper imported lemonade coming into the market?
• What if the government decides to add a tariff or quota on imported lemonade? (Ooh! Yikes! Hot topic!)
I have my students draw out the graphs for each scenario and identify areas under the curves given price interventions.
This Activity sets us up well for our next two modules: International Trade and Elasticity and Tax Burden.
Playing Card Game
♠️ For in-person classes (hybrid or fully face-to-face), we also play the Playing Card Game from MRU (Thanks, MRU!) to practice the idea of surplus and loss.
(Careful, this experiment can get LOUD and I’ve been yelled at by an instructor in the classroom next door for the awesome “engagement” of my students as they were participating. 😜)
Conclusion
My hope is that by the end of this jam‑packed module, students have first Paused to center themselves, actively Practiced the Supply & Demand model, and Played with scenarios that help them apply and integrate what they have learned with their peers.
We learn better together.
Small shifts matter — and we may not know the full magnitude, but we can see and feel the direction.
Screenshot of the Module
